Bootstrap Simulation
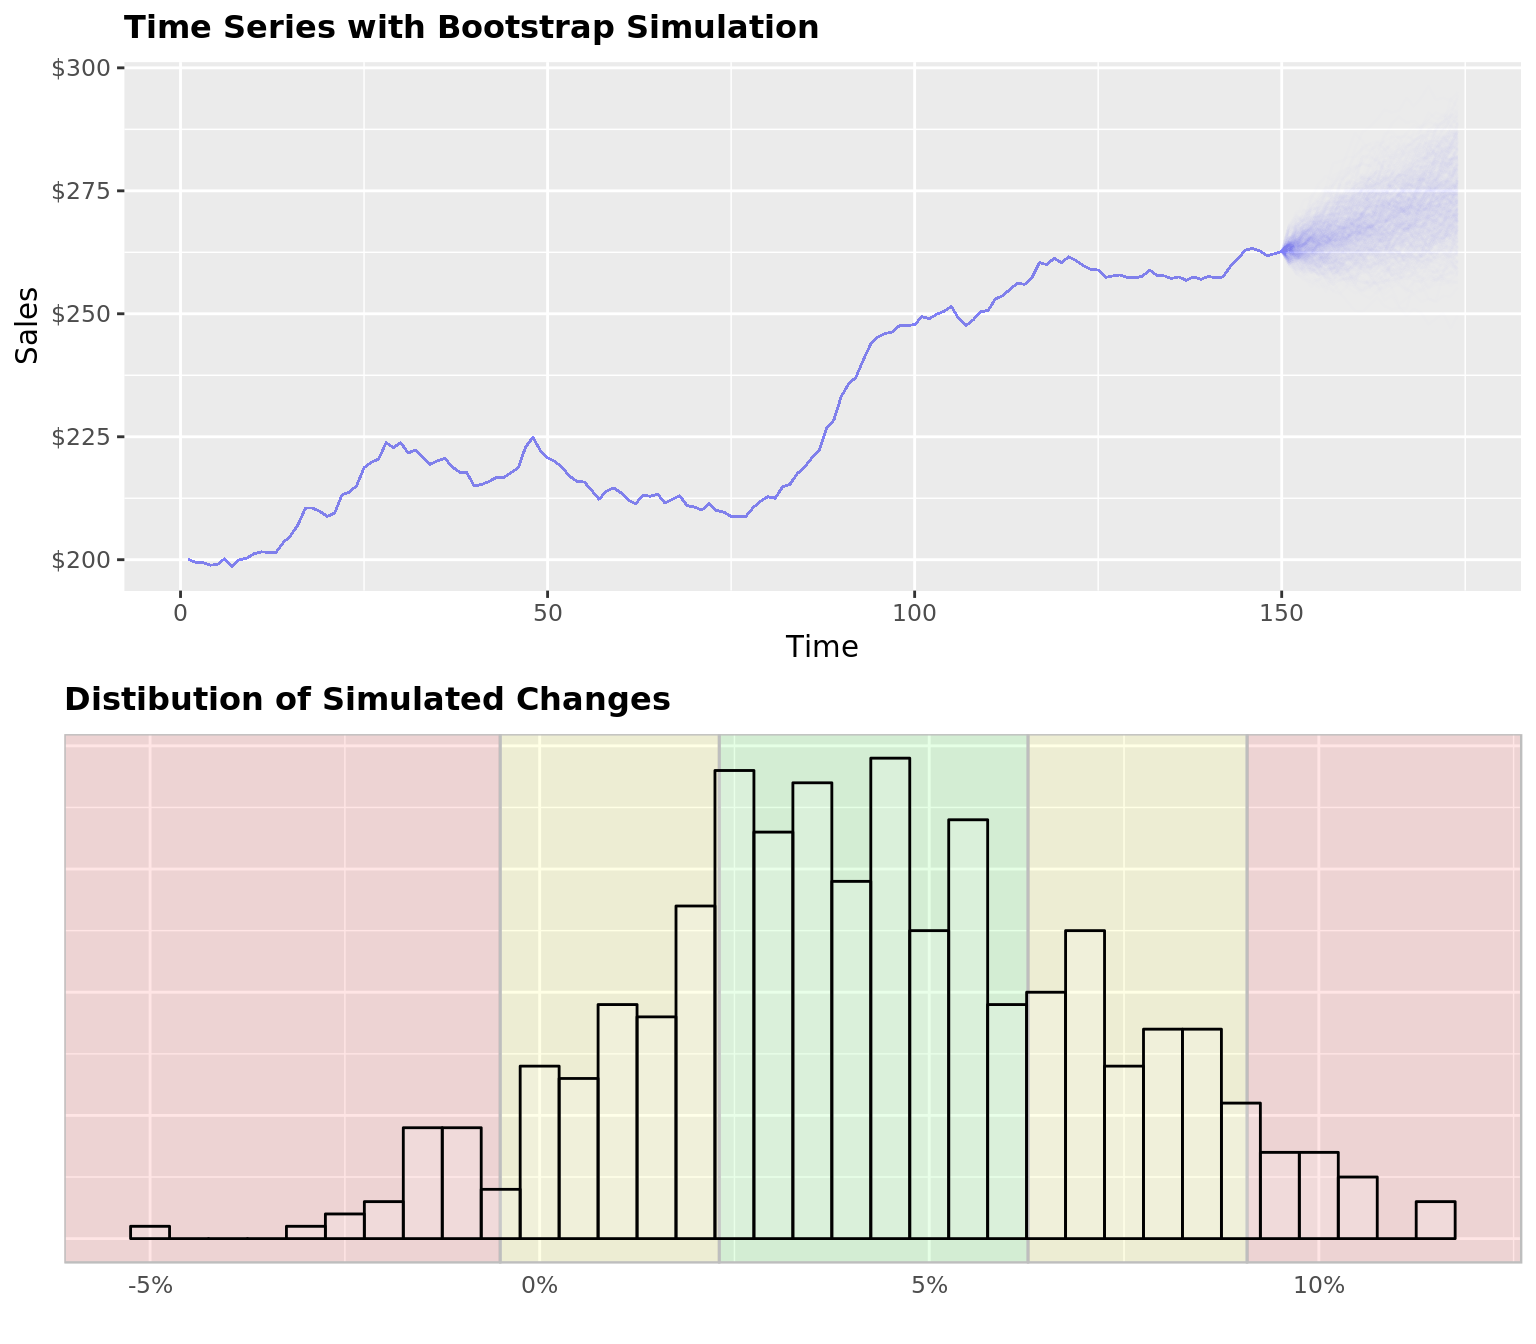
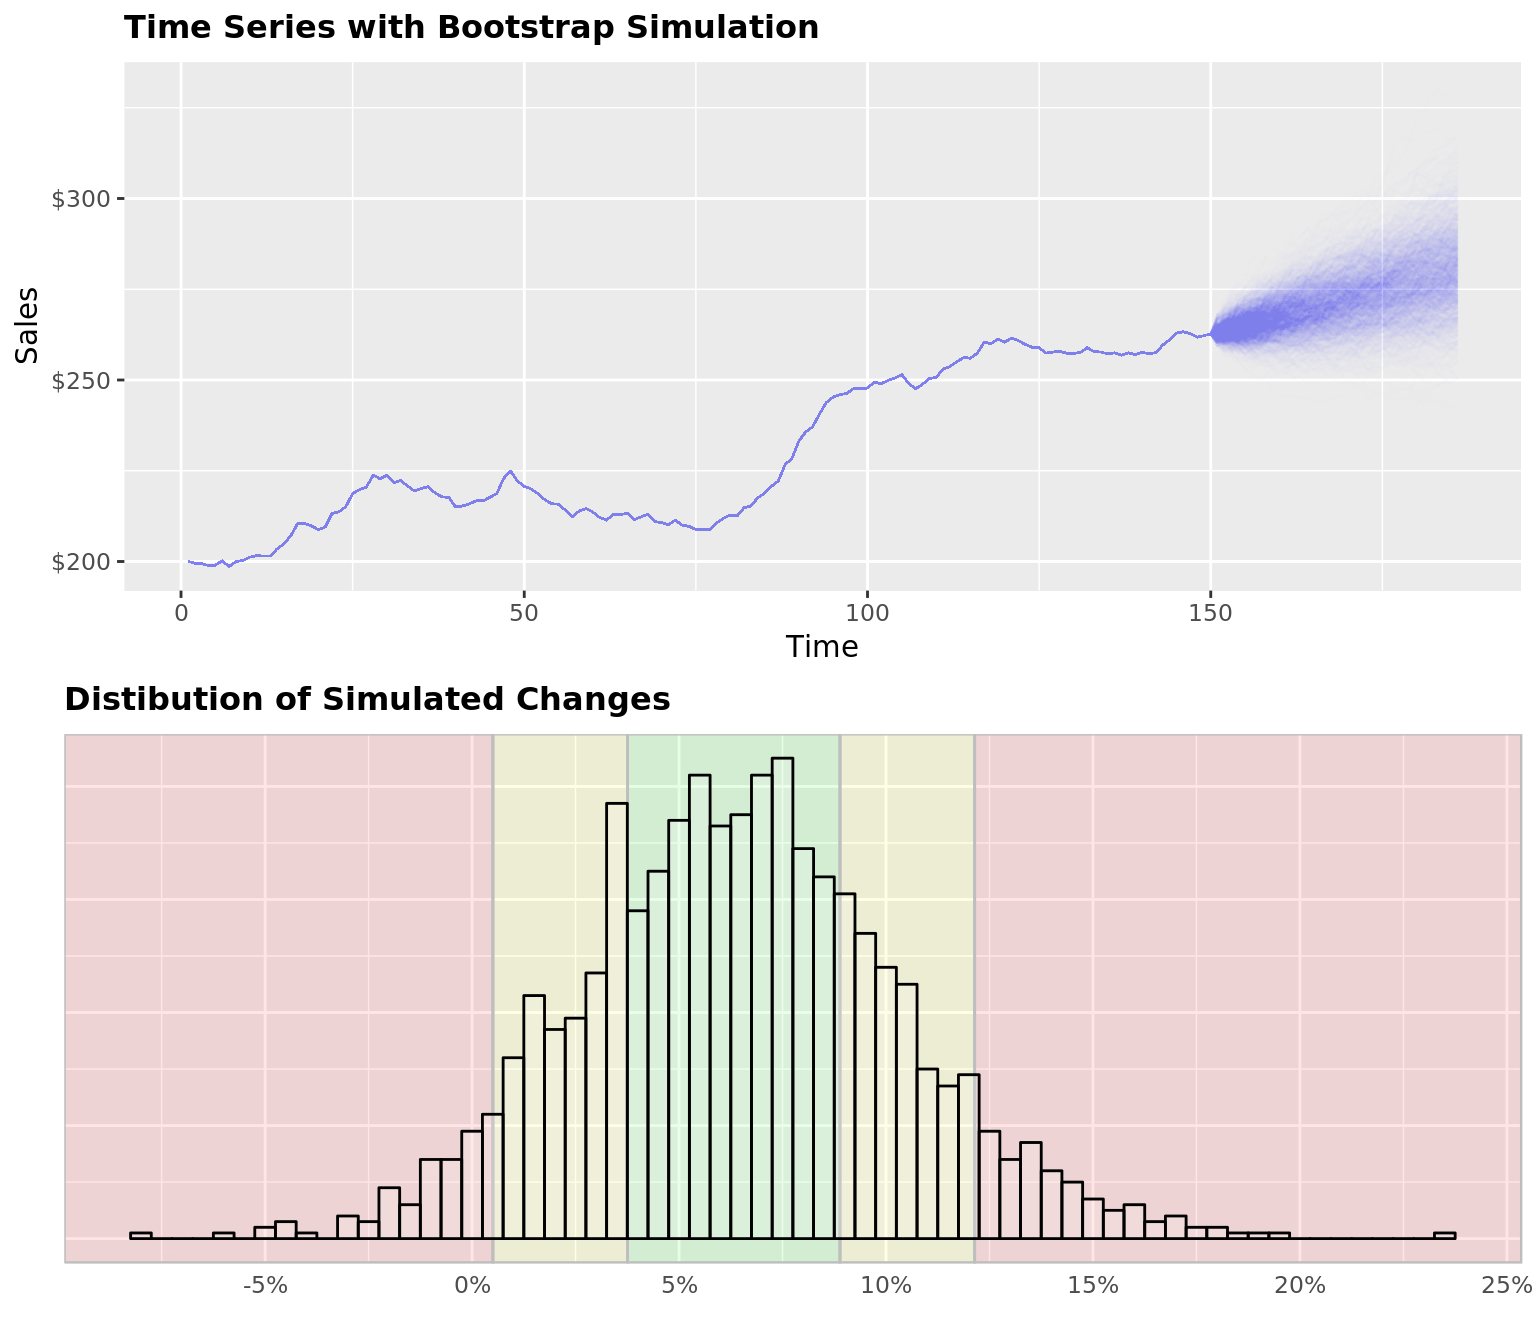
This script creates a function for running a simple bootstrap simulation from a given input. In this example I am using the data set BJsales from R. Bootstrap simulations work by pulling a series of random samples from the past and stringing them together to produce a possible future outcome.
You can specify how many months.back you want the simulation to pull samples from and how many months.forward you want the simulation to produce. If you want to use recent history make months.back a small number. If you want to project your simulation far out into the future, make months.forward a larger number. Specify the number of simulations (trials).
The function produces 2 plots. The first plot shows the original data as well as each individual simulated trial. The second plot is a distribution of the return or total percent change from the last historical value and the last months.forward value for each simulation.
The alpha parameter controls how transparent the lines are in the first graph.
library(ggplot2)
library(reshape2)
library(scales)
library(grid)
library(gridExtra)

data("BJsales")

boot.plot = function(dt, trials, months.back = 24, months.forward = 12, alph = .1) {

  ## calculate the change history
  lookup = 1 + (diff(dt) / dt)

  ## run run simulation by picking random percent changes from history
  ## repeat for the number of trials
  sims = data.frame()
  for (i in 1:trials) {

    sims =
      rbind(sims,
            matrix(
              sample(lookup, size = months.forward , replace = TRUE),
              nrow = 1)
      )
  }

  time = seq(151, 151 + months.forward - 1, by = 1)

  colnames(sims) = time

  sims[is.na(sims)] = 1

  last.price = dt[length(dt)]

  # calculate the price change from the last known price
  p.chg = data.frame(sims[, 1] * last.price)

  for (i in 2:months.forward) {p.chg = cbind(p.chg, p.chg[, i - 1] * sims[, i])}
  colnames(p.chg) = time

  # calculate the cumulative percent change
  cuml.new = sims[,] - 1
  cuml = data.frame(cuml.new[, 1])

  for (i in 2:months.forward) {cuml = cbind(cuml, cuml[, i - 1] + cuml.new[, i])}
  colnames(cuml) = time

  cuml.chg = data.frame("Price Change" = cuml[, length(cuml)])

  cuml$trial = 1:nrow(cuml)
  cuml = melt(cuml, id.vars = "trial")

  dt = data.frame(time = 1:length(dt), dt = dt)

  ## create graphics
  plot.price = dcast(dt, . ~ time)
  plot.price2 = cbind(plot.price, p.chg)
  plot.price2$trial = 1:nrow(plot.price2)
  plot.price2 = plot.price2[,-1]
  plot.price2 = melt(plot.price2, id.vars = c("trial"))


  cuml = data.frame("cuml.1qrt" = quantile(cuml.chg$Price.Change)[2],
                    "cuml.3qrt" = quantile(cuml.chg$Price.Change)[4],
                    "iqr.15" = quantile(cuml.chg$Price.Change)[4] -
                      quantile(cuml.chg$Price.Change)[2] * 1.5,
                    "med" = quantile(cuml.chg$Price.Change)[3])


  x1 = ggplot(cuml.chg) +
    geom_rect(aes(xmin = cuml.1qrt, xmax = cuml.3qrt, ymin = -Inf, ymax = Inf), data = cuml,
              fill = "green", color = "gray", alpha = .1) +
    geom_rect(aes(xmin = cuml.1qrt - iqr.15, xmax = cuml.1qrt,  ymin = -Inf, ymax = Inf), data = cuml,
              fill = "yellow", color = "gray", alpha = .1) +
    geom_rect(aes(xmin = cuml.3qrt, xmax = cuml.3qrt + iqr.15,  ymin = -Inf, ymax = Inf), data = cuml,
              fill = "yellow", color = "gray", alpha = .1) +
    geom_rect(aes(xmin = cuml.3qrt + iqr.15, xmax = Inf,  ymin = -Inf, ymax = Inf), data = cuml,
              fill = "red", color = "gray", alpha = .1) +
    geom_rect(aes(xmin = -Inf, xmax = cuml.1qrt - iqr.15,  ymin = -Inf, ymax = Inf), data = cuml,
              fill = "red", color = "gray", alpha = .1) +
    geom_histogram(aes(x = Price.Change), stat = "bin", binwidth = .005, fill = "white", color = "black",
             alpha = .15) +
    ggtitle("Distibution of Simulated Changes") +
    scale_x_continuous("", labels = percent, breaks = seq(-.5, .5, .05)) +
    scale_y_continuous("") +
    theme(plot.title = element_text(face = "bold", size = 12),
          axis.text.y = element_text(size = 0),
          axis.ticks = element_blank())

  plot.price2$variable = as.numeric(plot.price2$variable)

  x3 = ggplot(plot.price2, aes(x = variable, y = value, group = trial)) +
    geom_line(color = "blue", alpha = alph, se = FALSE) +
    scale_x_continuous("Time") +
    scale_y_continuous("Sales", labels = dollar) +
    theme(plot.title = element_text(face = "bold", size = 12)) +
    ggtitle("Time Series with Bootstrap Simulation")


  return(grid.arrange(x3, x1, nrow = 2))
}## Warning: Ignoring unknown parameters: se
## Warning: Ignoring unknown parameters: se
## Warning: Ignoring unknown parameters: se
boot.plot = function(dt, trials, months.back = 24, months.forward = 12, alph = .1) {

  ## calculate the change history
  lookup = 1 + (diff(dt) / dt)

  ## run run simulation by picking random percent changes from history
  ## repeat for the number of trials
  sims = data.frame()
  for (i in 1:trials) {

    sims =
      rbind(sims,
            matrix(
              sample(lookup, size = months.forward , replace = TRUE),
              nrow = 1)
      )
  }

  time = seq(151, 151 + months.forward - 1, by = 1)

  colnames(sims) = time

  sims[is.na(sims)] = 1

  last.price = dt[length(dt)]

  # calculate the price change from the last known price
  p.chg = data.frame(sims[, 1] * last.price)

  for (i in 2:months.forward) {p.chg = cbind(p.chg, p.chg[, i - 1] * sims[, i])}
  colnames(p.chg) = time

  # calculate the cumulative percent change
  cuml.new = sims[,] - 1
  cuml = data.frame(cuml.new[, 1])

  for (i in 2:months.forward) {cuml = cbind(cuml, cuml[, i - 1] + cuml.new[, i])}
  colnames(cuml) = time

  cuml.chg = data.frame("Price Change" = cuml[, length(cuml)])

  cuml$trial = 1:nrow(cuml)
  cuml = melt(cuml, id.vars = "trial")

  dt = data.frame(time = 1:length(dt), dt = dt)

  ## create graphics
  plot.price = dcast(dt, . ~ time)
  plot.price2 = cbind(plot.price, p.chg)
  plot.price2$trial = 1:nrow(plot.price2)
  plot.price2 = plot.price2[,-1]
  plot.price2 = melt(plot.price2, id.vars = c("trial"))


  cuml = data.frame("cuml.1qrt" = quantile(cuml.chg$Price.Change)[2],
                    "cuml.3qrt" = quantile(cuml.chg$Price.Change)[4],
                    "iqr.15" = quantile(cuml.chg$Price.Change)[4] -
                      quantile(cuml.chg$Price.Change)[2] * 1.5,
                    "med" = quantile(cuml.chg$Price.Change)[3])


  x1 = ggplot(cuml.chg) +
    geom_rect(aes(xmin = cuml.1qrt, xmax = cuml.3qrt, ymin = -Inf, ymax = Inf), data = cuml,
              fill = "green", color = "gray", alpha = .1) +
    geom_rect(aes(xmin = cuml.1qrt - iqr.15, xmax = cuml.1qrt,  ymin = -Inf, ymax = Inf), data = cuml,
              fill = "yellow", color = "gray", alpha = .1) +
    geom_rect(aes(xmin = cuml.3qrt, xmax = cuml.3qrt + iqr.15,  ymin = -Inf, ymax = Inf), data = cuml,
              fill = "yellow", color = "gray", alpha = .1) +
    geom_rect(aes(xmin = cuml.3qrt + iqr.15, xmax = Inf,  ymin = -Inf, ymax = Inf), data = cuml,
              fill = "red", color = "gray", alpha = .1) +
    geom_rect(aes(xmin = -Inf, xmax = cuml.1qrt - iqr.15,  ymin = -Inf, ymax = Inf), data = cuml,
              fill = "red", color = "gray", alpha = .1) +
    geom_histogram(aes(x = Price.Change), stat = "bin", binwidth = .005, fill = "white", color = "black",
             alpha = .15) +
    ggtitle("Distibution of Simulated Changes") +
    scale_x_continuous("", labels = percent, breaks = seq(-.5, .5, .05)) +
    scale_y_continuous("") +
    theme(plot.title = element_text(face = "bold", size = 12),
          axis.text.y = element_text(size = 0),
          axis.ticks = element_blank())

  plot.price2$variable = as.numeric(plot.price2$variable)

  x3 = ggplot(plot.price2, aes(x = variable, y = value, group = trial)) +
    geom_line(color = "blue", alpha = alph, se = FALSE) +
    scale_x_continuous("Time") +
    scale_y_continuous("Sales", labels = dollar) +
    theme(plot.title = element_text(face = "bold", size = 12)) +
    ggtitle("Time Series with Bootstrap Simulation")


  return(grid.arrange(x3, x1, nrow = 2))
}