Neural Network
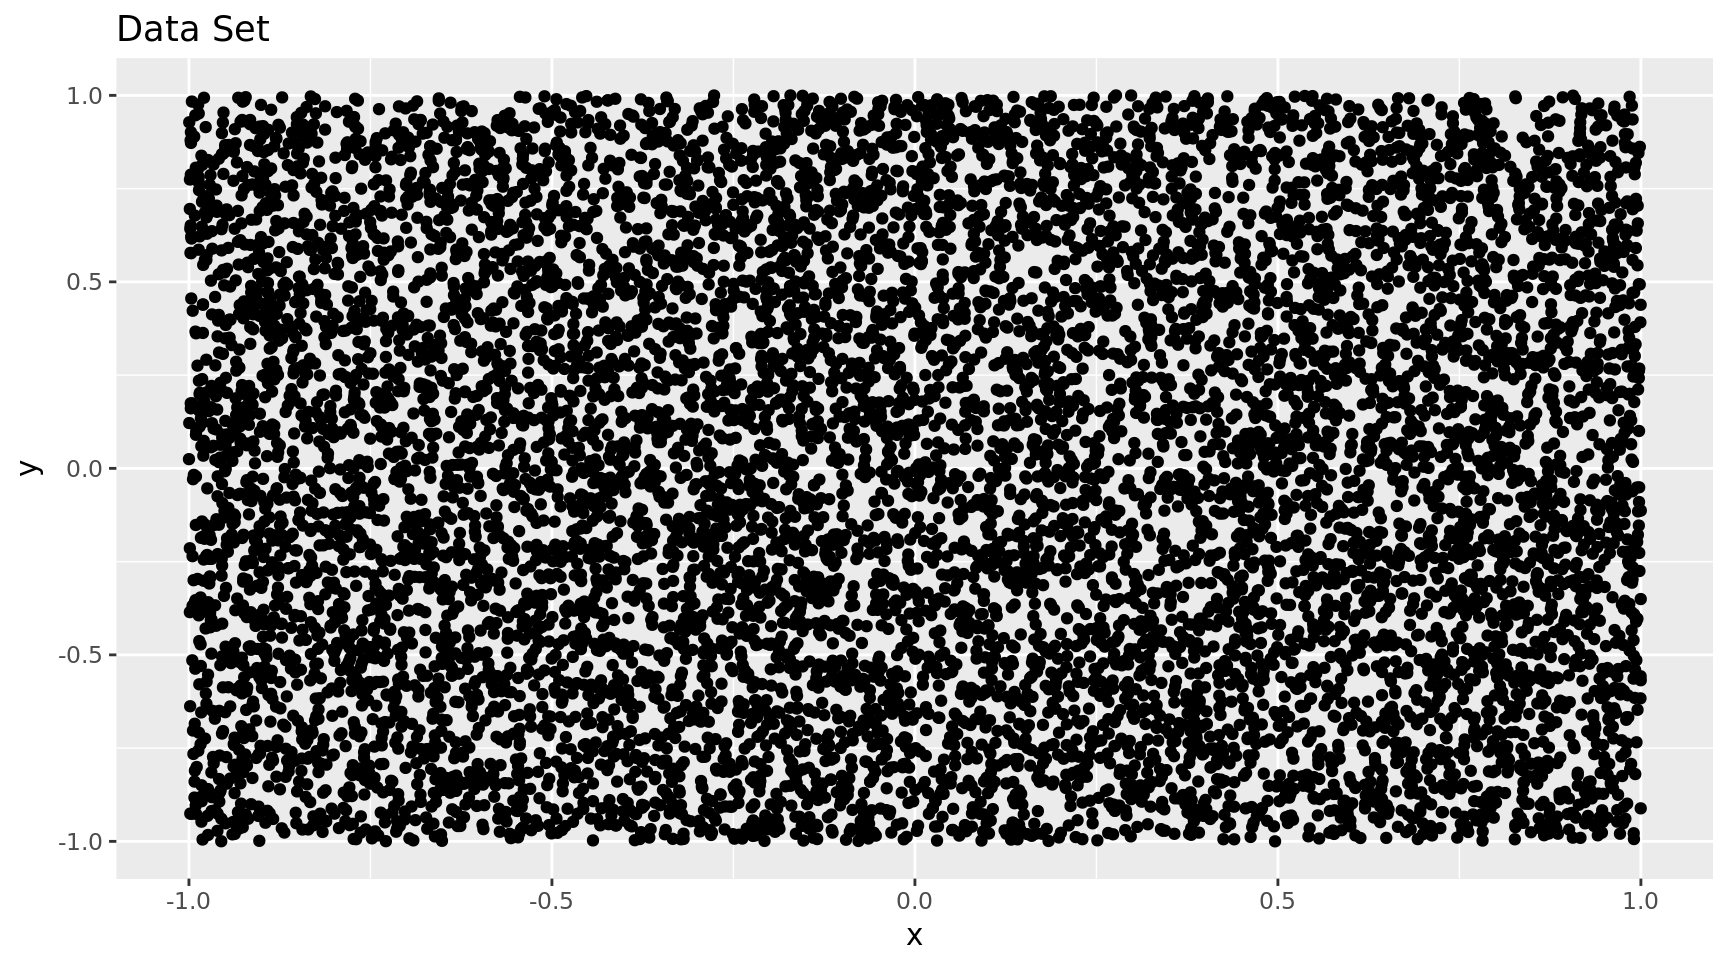
## Calculate the distance to the origin
dt$dto = with(dt, sqrt(x^2 + y^2))

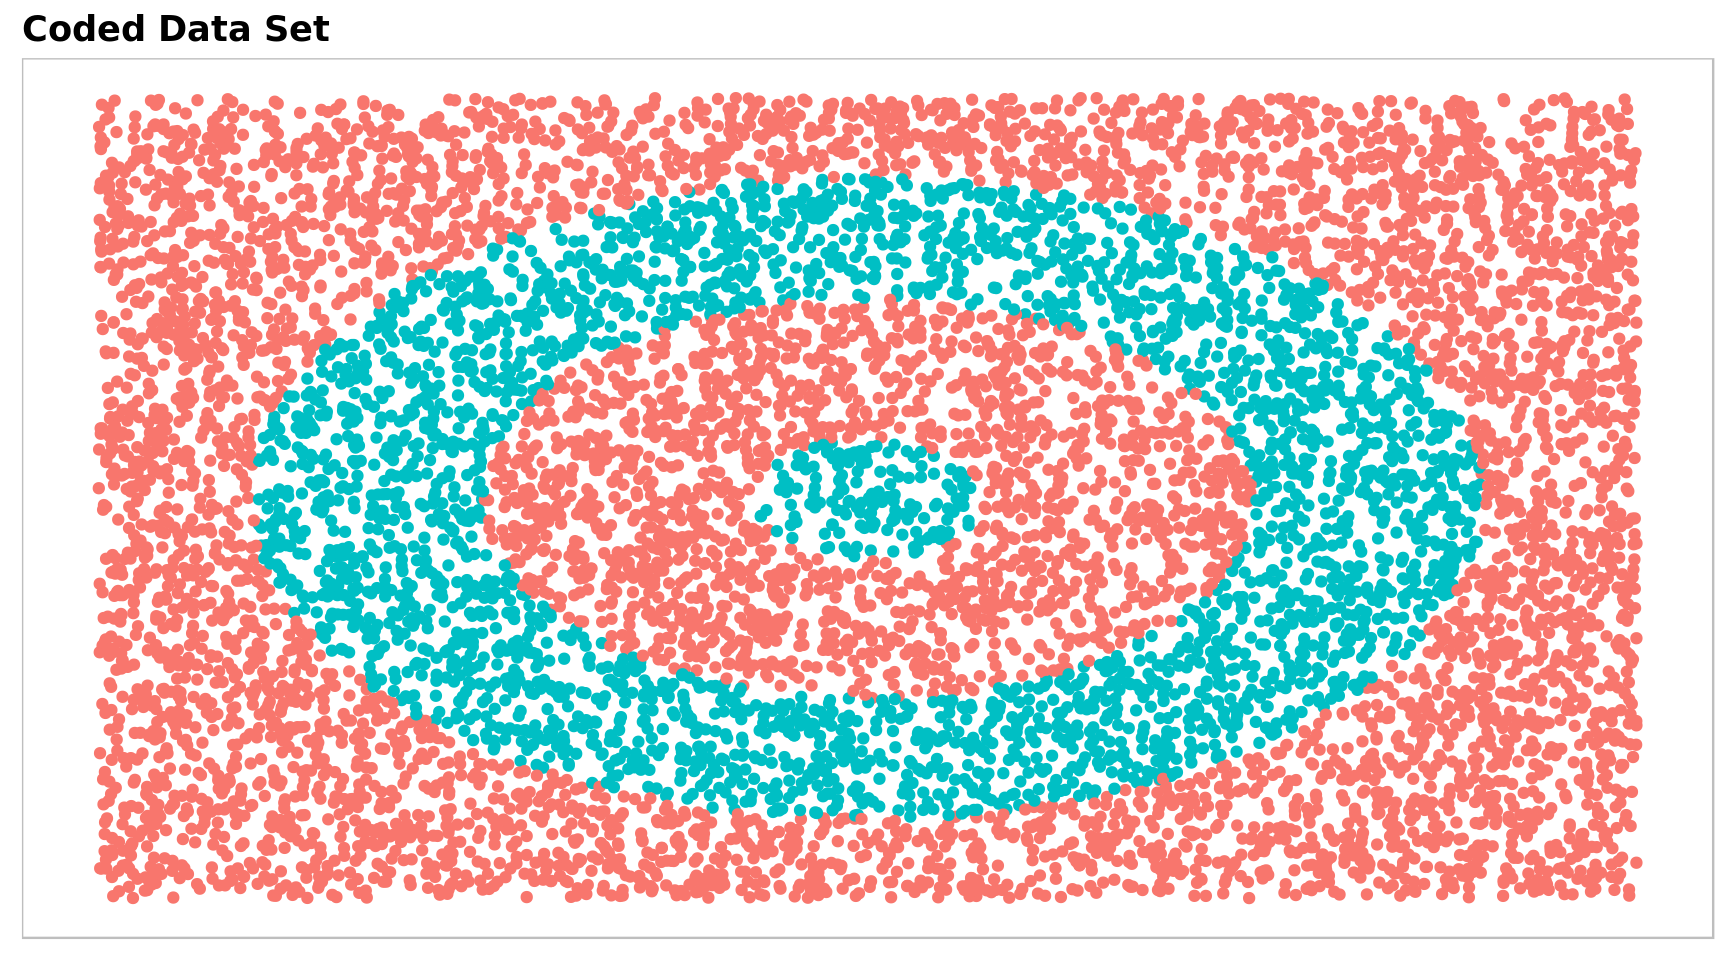
## Create a bullseye basid on distance to origin
dt$code = 0
dt$code[dt$dto < .8] = 1
dt$code[dt$dto < .5] = 0
dt$code[dt$dto < .15] = 1

## Code the indicator
dt$code2 = class.ind(dt$code)


## Create a custom plot theme
theme_jeb = function() {
  theme(panel.background = element_blank(),
        panel.border = element_rect(color = "gray", fill = NA),
        panel.grid = element_blank(),
        axis.text = element_blank(),
        axis.ticks = element_blank(),
        axis.title = element_blank(),
        plot.title = element_text(face = "bold"))
}

## Main plot of the testing set
g1 = ggplot(dt, aes(x = x, y = y)) +
  geom_point(aes(col = factor(code))) +
  scale_color_discrete(guide = FALSE) +
  ggtitle("Coded Data Set") +
  theme_jeb()

g1
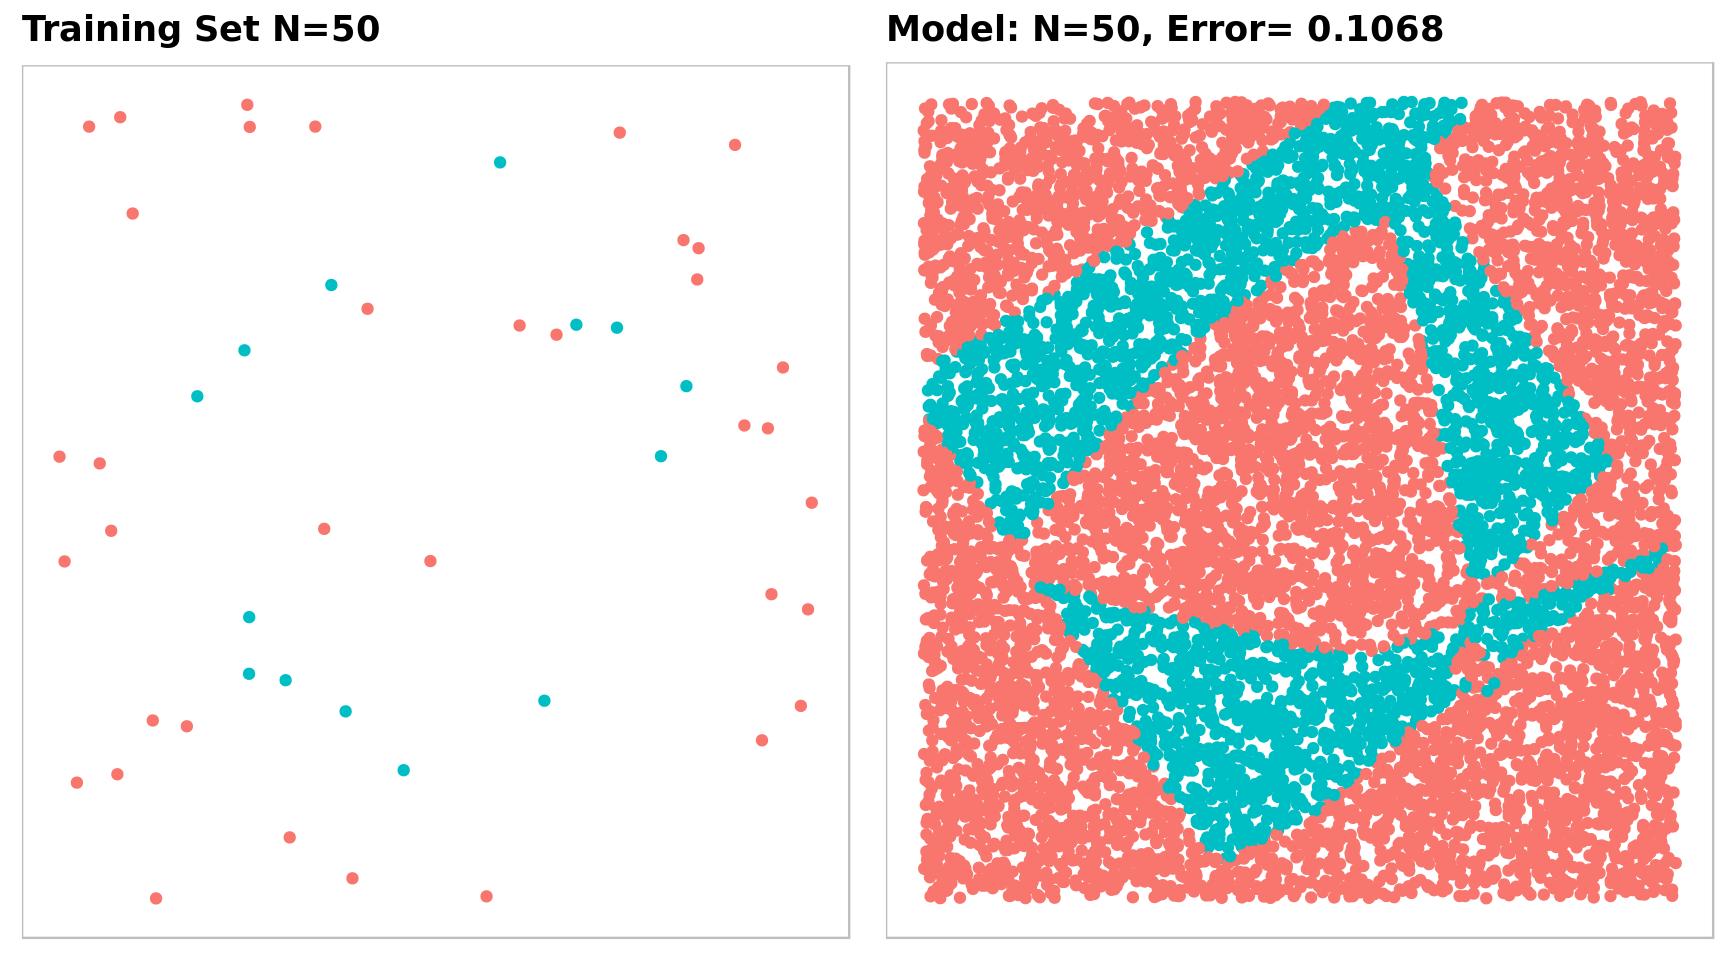
## Train the NN from 50 random samples of the data set
samp = sample(n, 50, replace = FALSE)
mdl = nnet(code2 ~ x + y, data = dt[samp,], size = size, softmax = TRUE,
           maxit = maxit, trace = FALSE)
dt$out = factor(predict(mdl, dt, type = "class"))


g2 = ggplot(dt[samp, ], aes(x = x, y = y)) +
  geom_point(aes(col = factor(code))) +
  scale_color_discrete(guide = FALSE) +
  ggtitle("Training Set N=50") +
  theme_jeb()

g3 = ggplot(dt, aes(x = x, y = y)) +
  geom_point(aes(col = out)) +
  scale_color_discrete(guide = FALSE) +
  ggtitle(paste("Model: N=50,", "Error=",
                length(which(as.numeric(dt$out)-as.numeric(dt$code) == 0))/n)) +
  theme_jeb()

grid.arrange(g2, g3, nrow = 1)
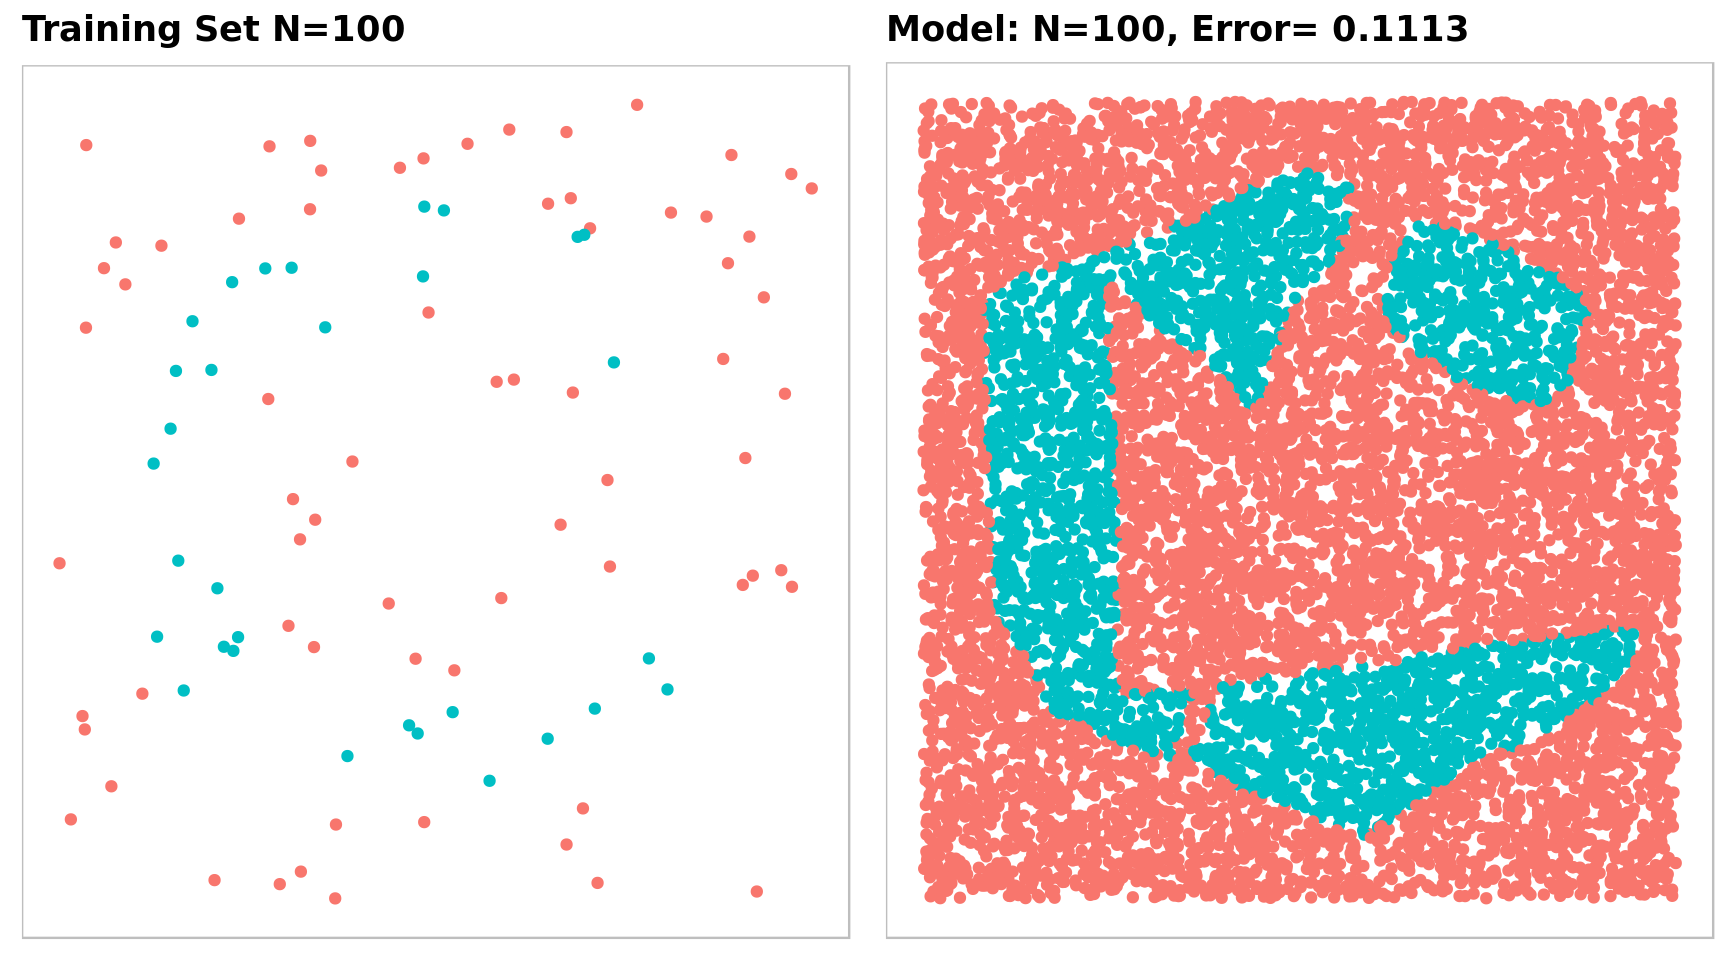
## 100 random samples
samp = sample(n, 100, replace = FALSE)
mdl = nnet(code2 ~ x + y, data = dt[samp,], size = size, softmax = TRUE,
           maxit = maxit, trace = FALSE)
dt$out.100 = factor(predict(mdl, dt, type = "class"))

g4 = ggplot(dt[samp, ], aes(x = x, y = y)) +
  geom_point(aes(col = factor(code))) +
  scale_color_discrete(guide = FALSE) +
  ggtitle("Training Set N=100") +
  theme_jeb()

g5 = ggplot(dt, aes(x = x, y = y)) +
  geom_point(aes(col = out.100)) +
  scale_color_discrete(guide = FALSE) +
  ggtitle(paste("Model: N=100,", "Error=",
                length(which(as.numeric(dt$out.100)-as.numeric(dt$code) == 0))/n)) +
  theme_jeb()

grid.arrange(g4, g5, nrow = 1)
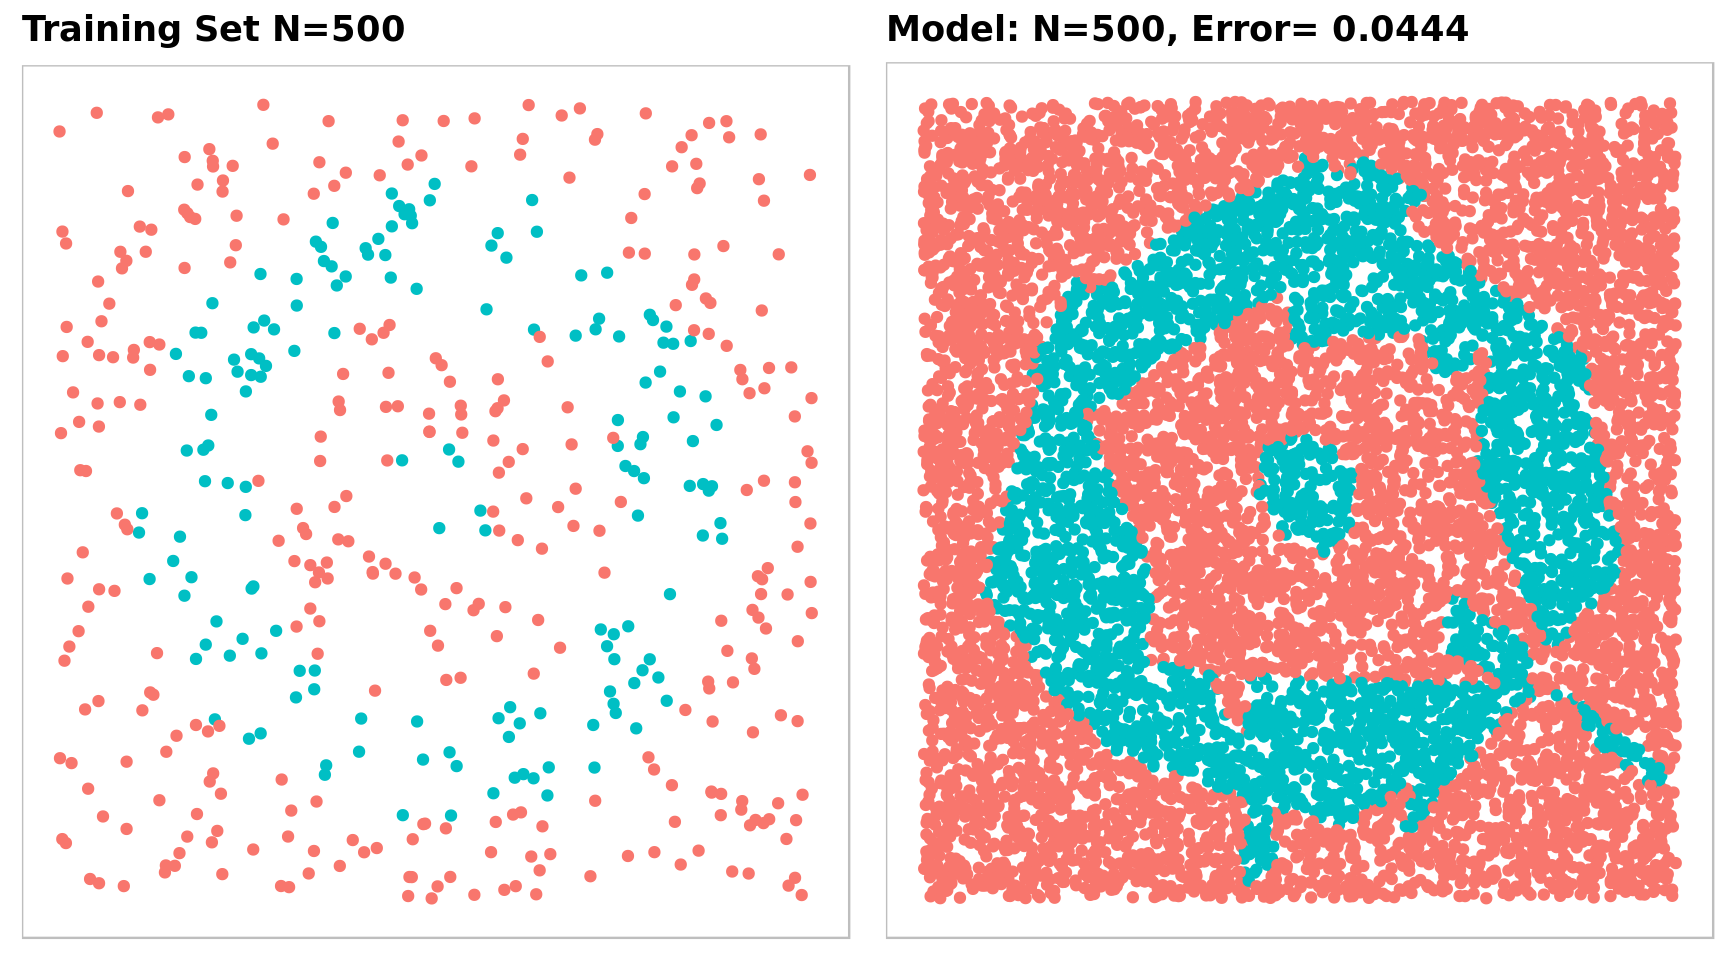
## 500 random samples
samp = sample(n, 500, replace = FALSE)
mdl = nnet(code2 ~ x + y, data = dt[samp,], size = size, softmax = TRUE,
           maxit = maxit, trace = FALSE)
dt$out.500 = factor(predict(mdl, dt, type = "class"))

g6 = ggplot(dt[samp, ], aes(x = x, y = y)) +
  geom_point(aes(col = factor(code))) +
  scale_color_discrete(guide = FALSE) +
  ggtitle("Training Set N=500") +
  theme_jeb()

g7 = ggplot(dt, aes(x = x, y = y)) +
  geom_point(aes(col = out.500)) +
  scale_color_discrete(guide = FALSE) +
  ggtitle(paste("Model: N=500,", "Error=",
                length(which(as.numeric(dt$out.500)-as.numeric(dt$code) == 0))/n)) +
  theme_jeb()

grid.arrange(g6, g7, nrow = 1)
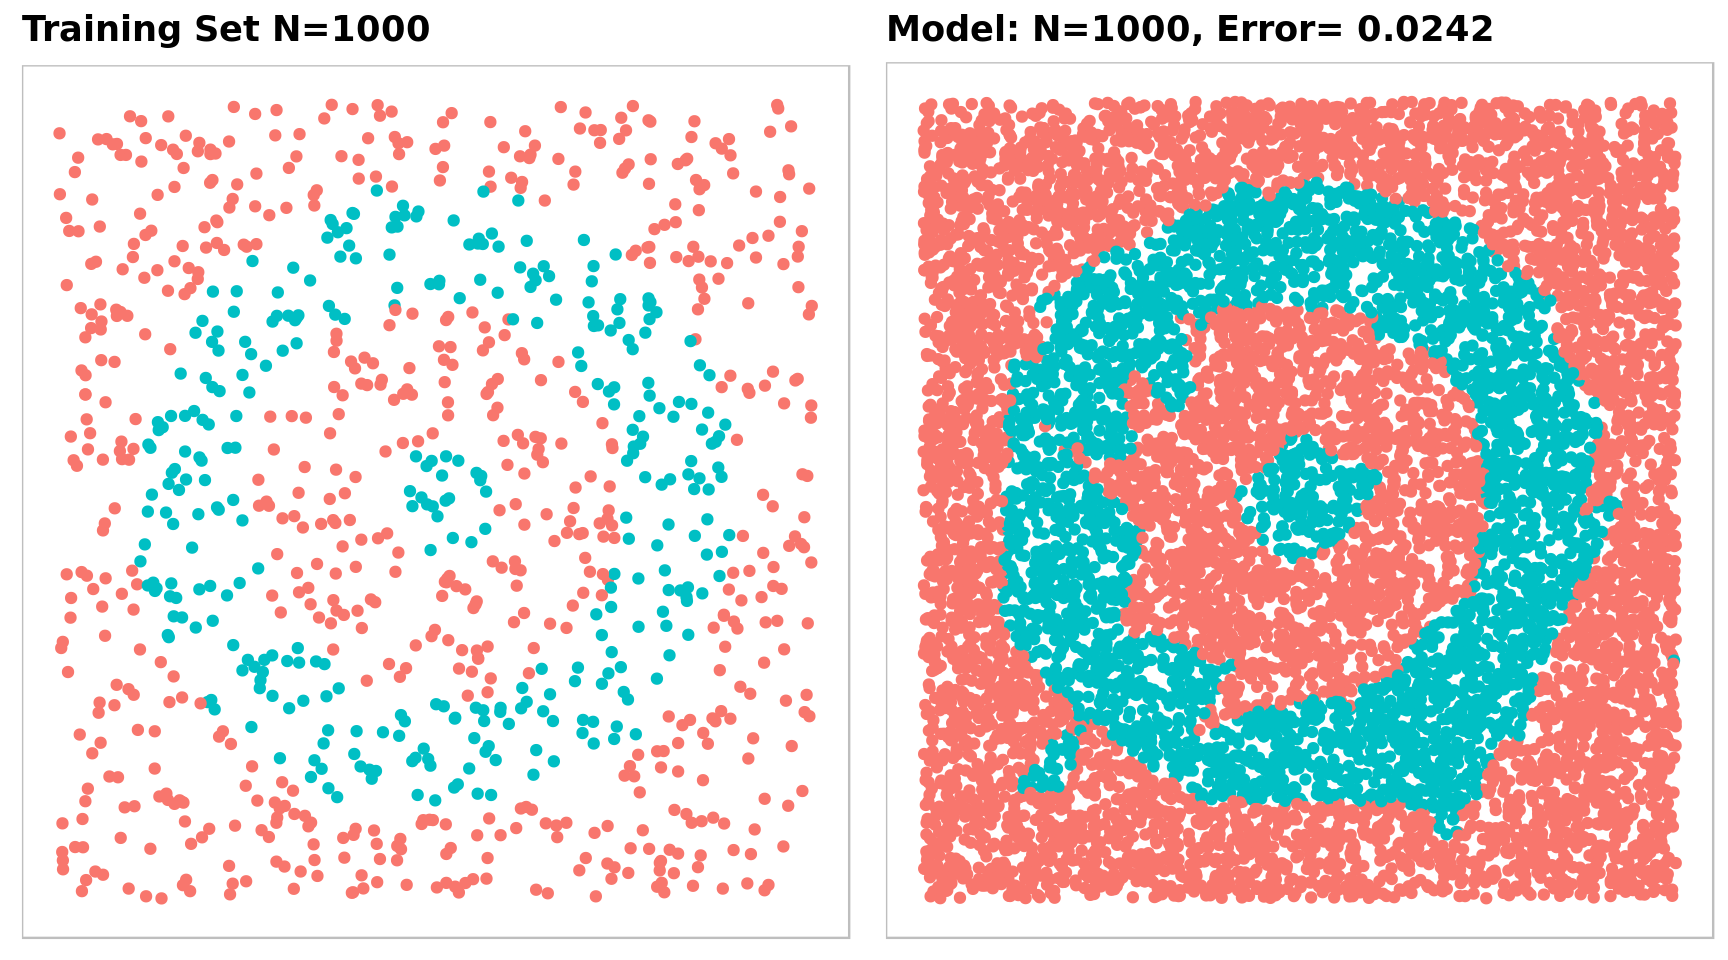
## 1000 random samples
samp = sample(n, 1000, replace = FALSE)
mdl = nnet(code2 ~ x + y, data = dt[samp,], size = size, softmax = TRUE,
           maxit = maxit, trace = FALSE)
dt$out.1000 = factor(predict(mdl, dt, type = "class"))

g8 = ggplot(dt[samp, ], aes(x = x, y = y)) +
  geom_point(aes(col = factor(code))) +
  scale_color_discrete(guide = FALSE) +
  ggtitle("Training Set N=1000") +
  theme_jeb()

g9 = ggplot(dt, aes(x = x, y = y)) +
  geom_point(aes(col = out.1000)) +
  scale_color_discrete(guide = FALSE) +
  ggtitle(paste("Model: N=1000,", "Error=",
                length(which(as.numeric(dt$out.1000)-as.numeric(dt$code) == 0))/n)) +
  theme_jeb()

grid.arrange(g8, g9, nrow = 1)
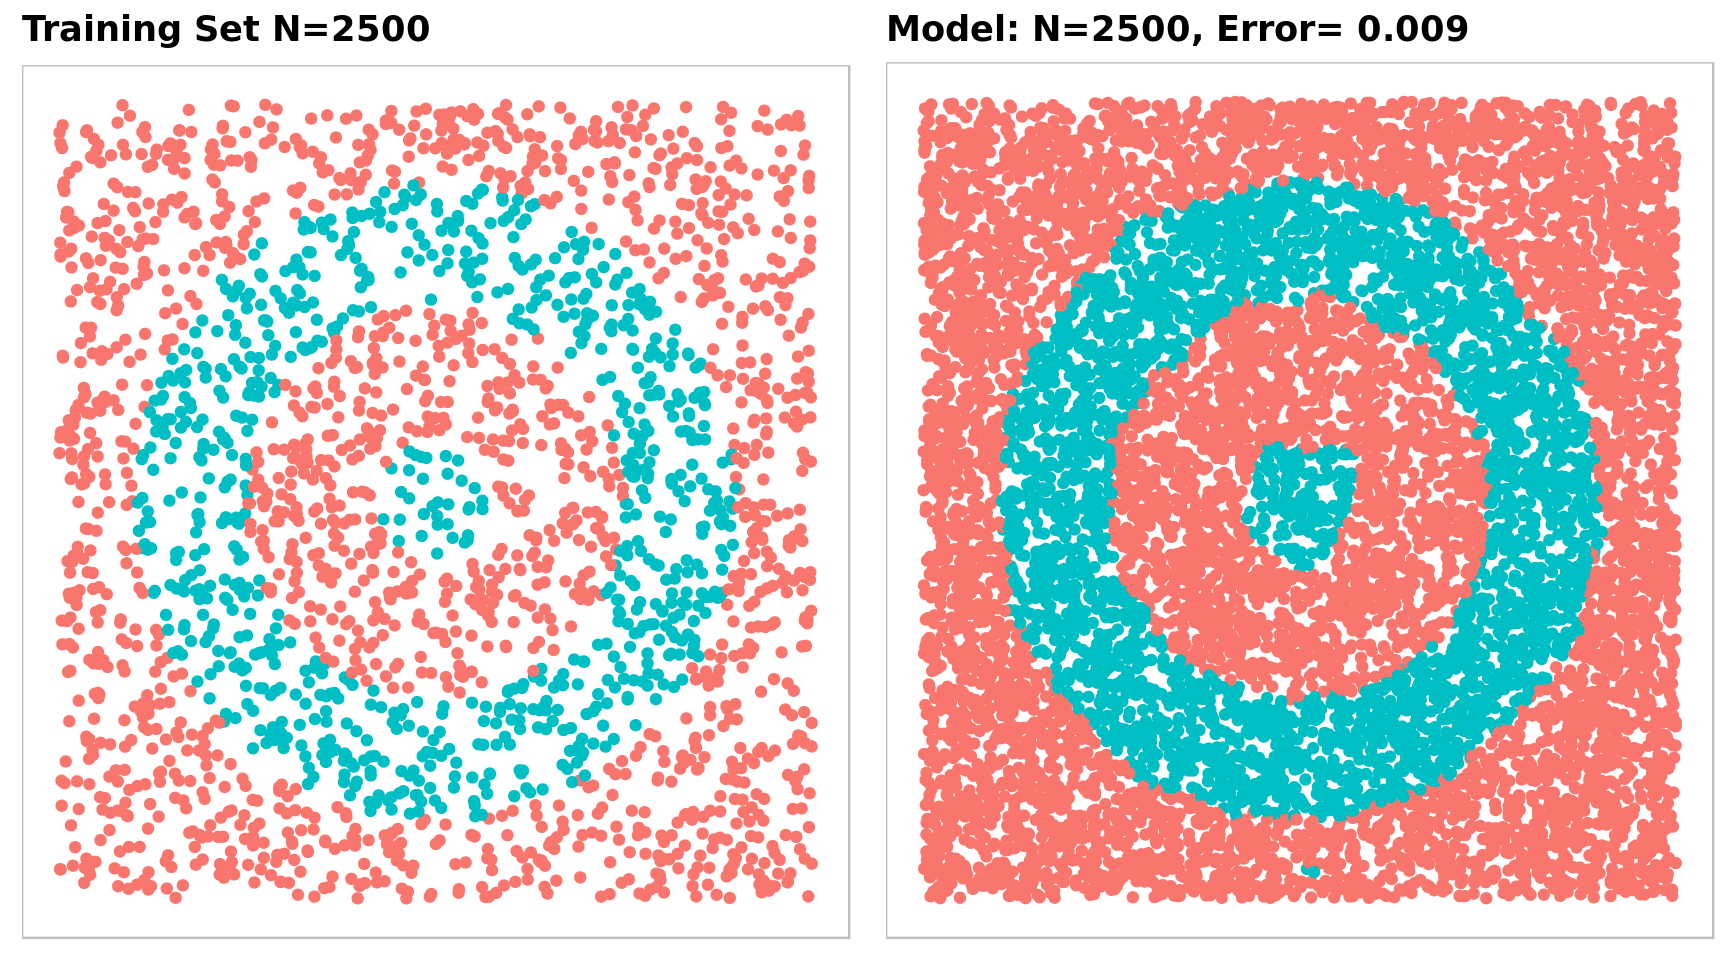
## 2500 random samples
samp = sample(n, 2500, replace = FALSE)
mdl = nnet(code2 ~ x + y, data = dt[samp,], size = size, softmax = TRUE,
           maxit = maxit, trace = FALSE)
dt$out.2500 = factor(predict(mdl, dt, type = "class"))

g10 = ggplot(dt[samp, ], aes(x = x, y = y)) +
  geom_point(aes(col = factor(code))) +
  scale_color_discrete(guide = FALSE) +
  ggtitle("Training Set N=2500") +
  theme_jeb()

g11 = ggplot(dt, aes(x = x, y = y)) +
  geom_point(aes(col = out.2500)) +
  scale_color_discrete(guide = FALSE) +
  ggtitle(paste("Model: N=2500,", "Error=",
                length(which(as.numeric(dt$out.2500)-as.numeric(dt$code) == 0))/n)) +
  theme_jeb()

grid.arrange(g10, g11, nrow = 1)
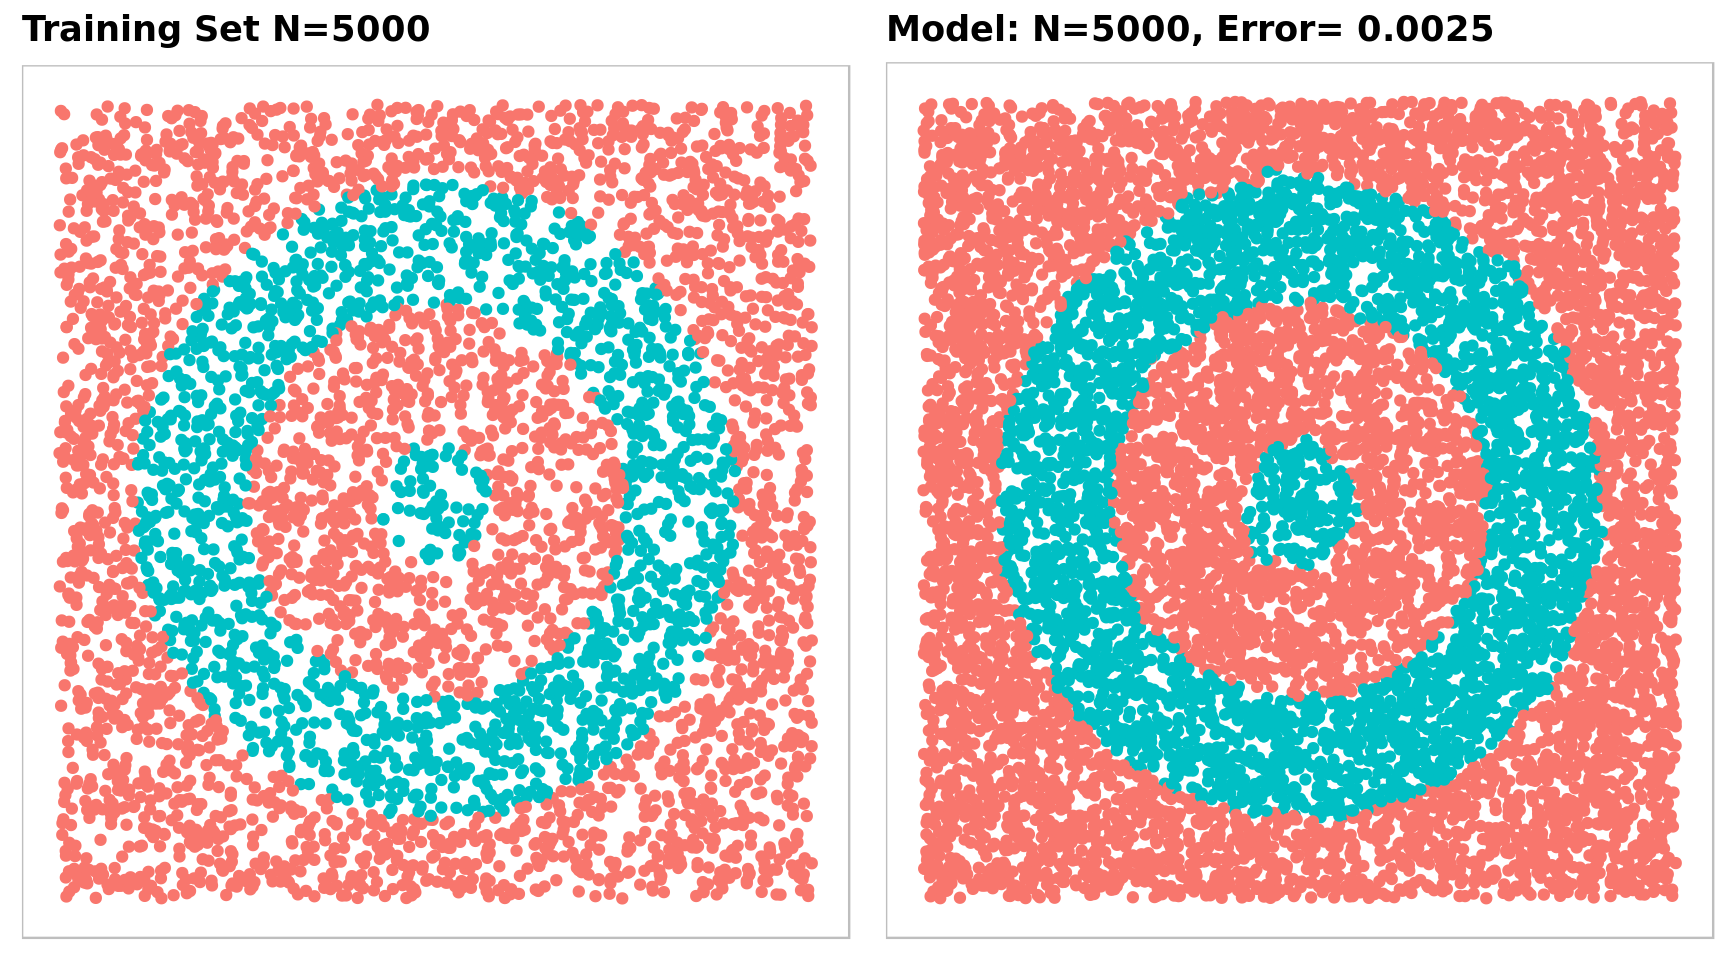
## 5000 random samples
samp = sample(n, 5000, replace = FALSE)
mdl = nnet(code2 ~ x + y, data = dt[samp,], size = size, softmax = TRUE,
           maxit = maxit, trace = FALSE)
dt$out.5000 = factor(predict(mdl, dt, type = "class"))

g12 = ggplot(dt[samp, ], aes(x = x, y = y)) +
  geom_point(aes(col = factor(code))) +
  scale_color_discrete(guide = FALSE) +
  ggtitle("Training Set N=5000") +
  theme_jeb()

g13 = ggplot(dt, aes(x = x, y = y)) +
  geom_point(aes(col = out.5000)) +
  scale_color_discrete(guide = FALSE) +
  ggtitle(paste("Model: N=5000,", "Error=",
                length(which(as.numeric(dt$out.5000)-as.numeric(dt$code) == 0))/n)) +
  theme_jeb()

grid.arrange(g12, g13, nrow = 1)
