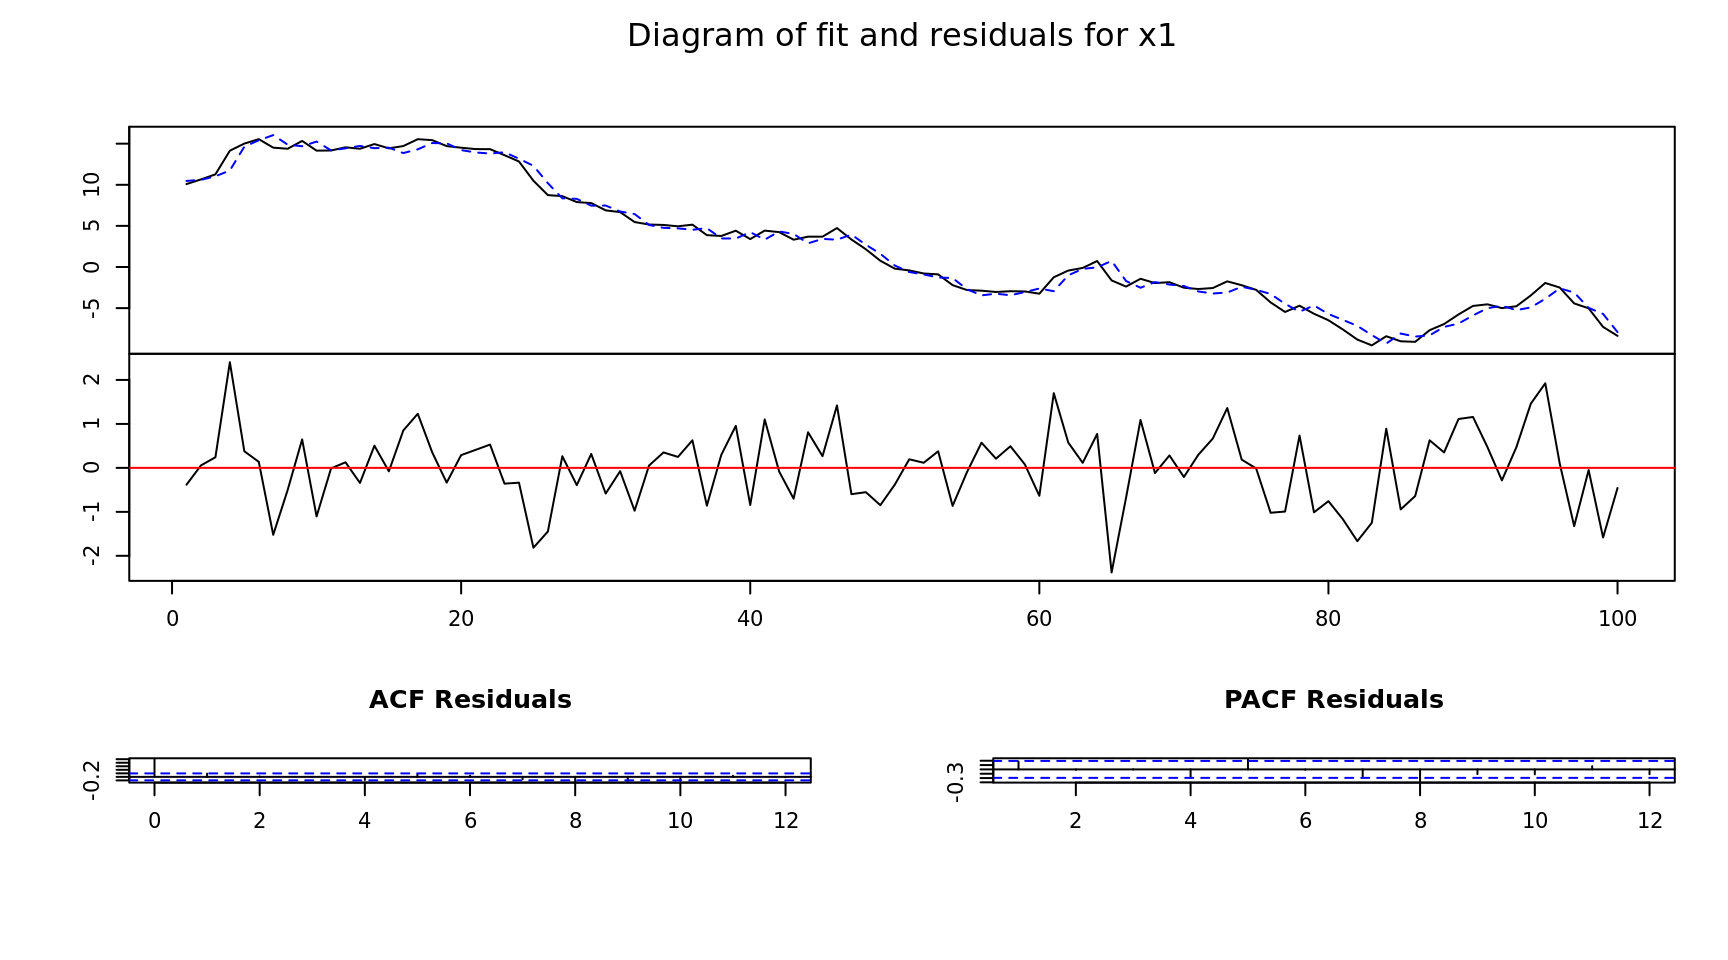
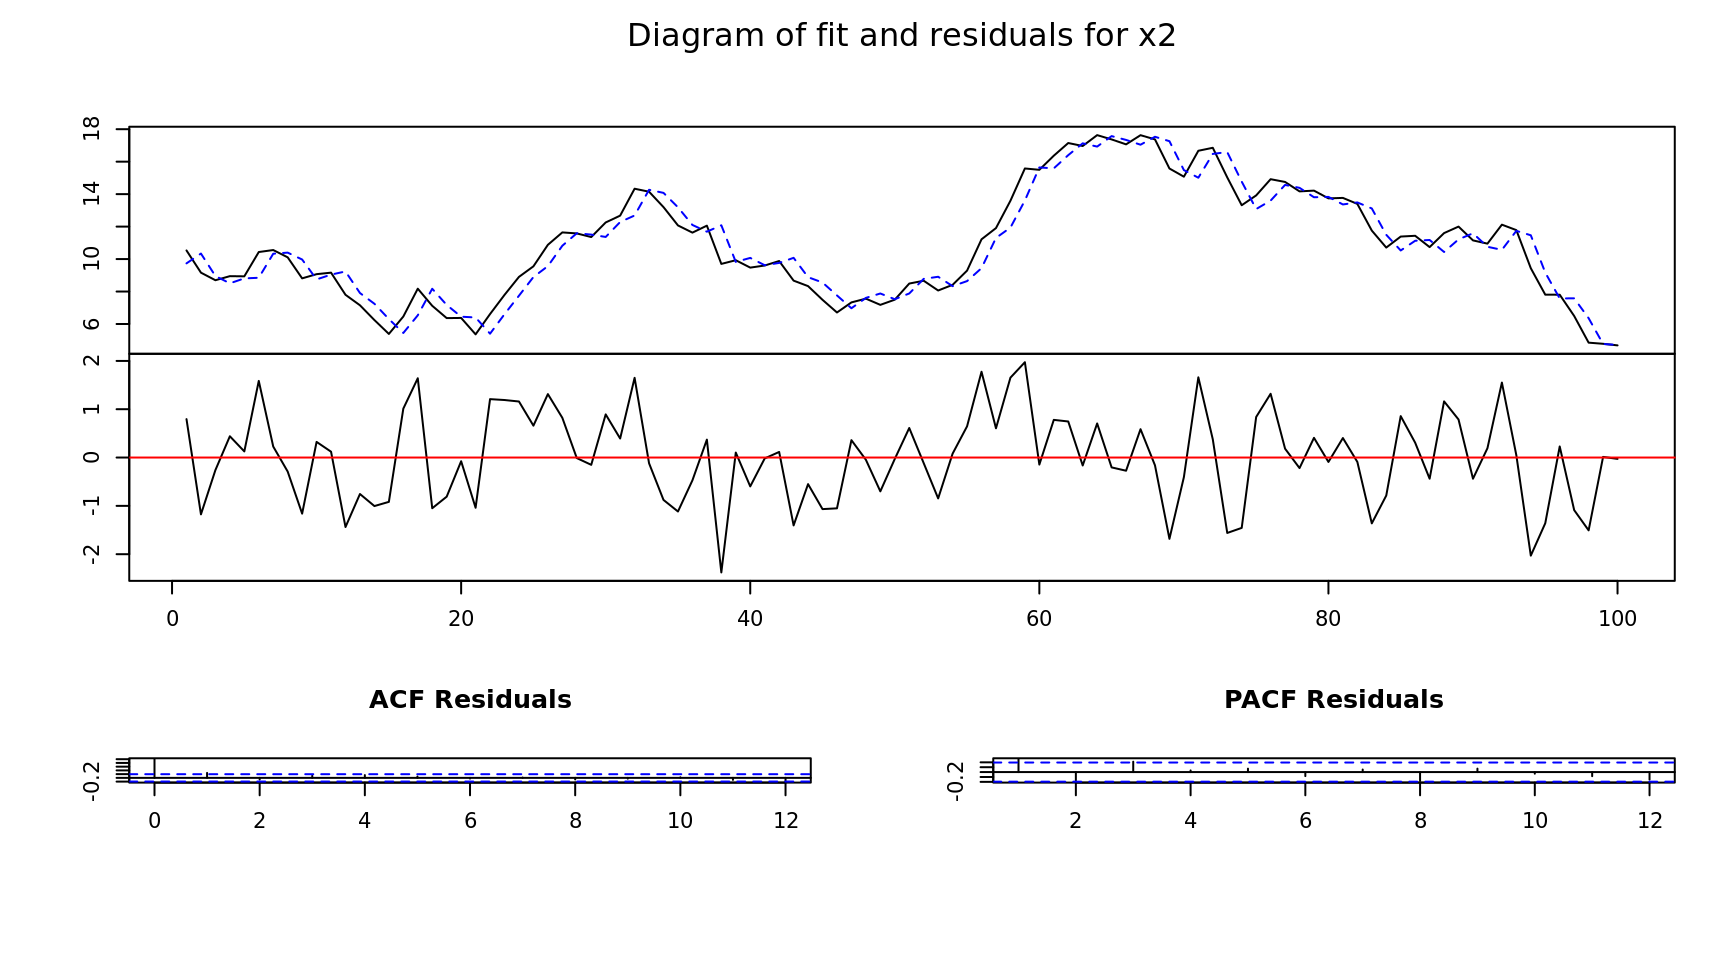
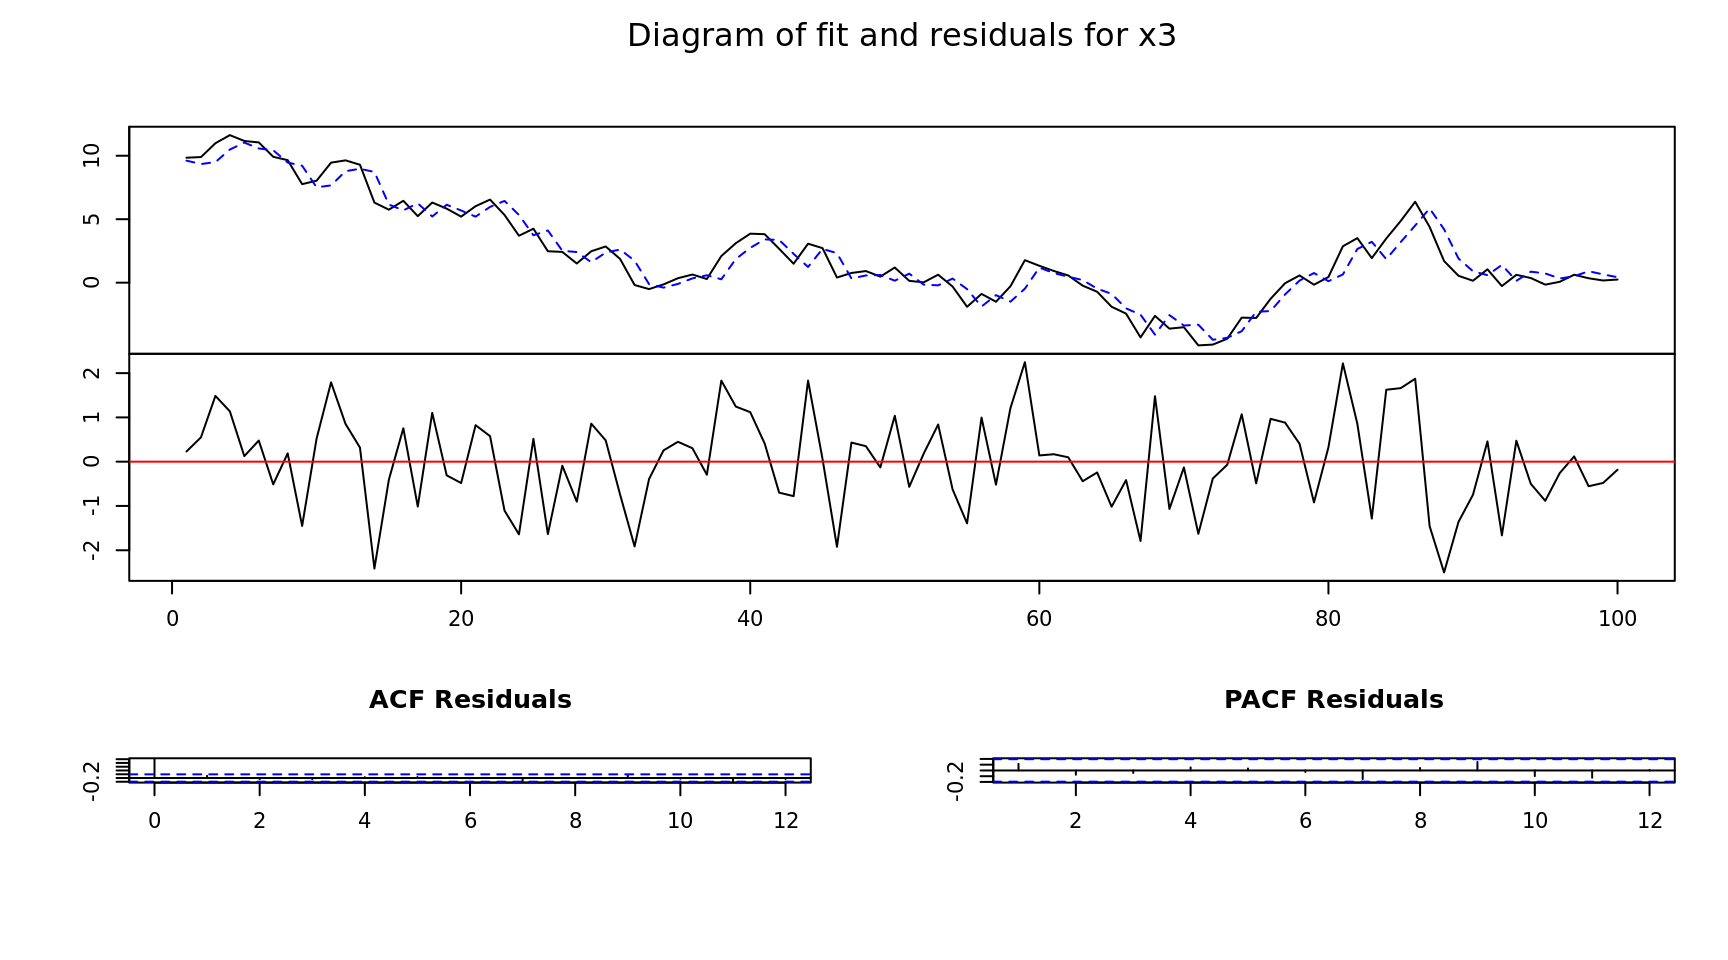
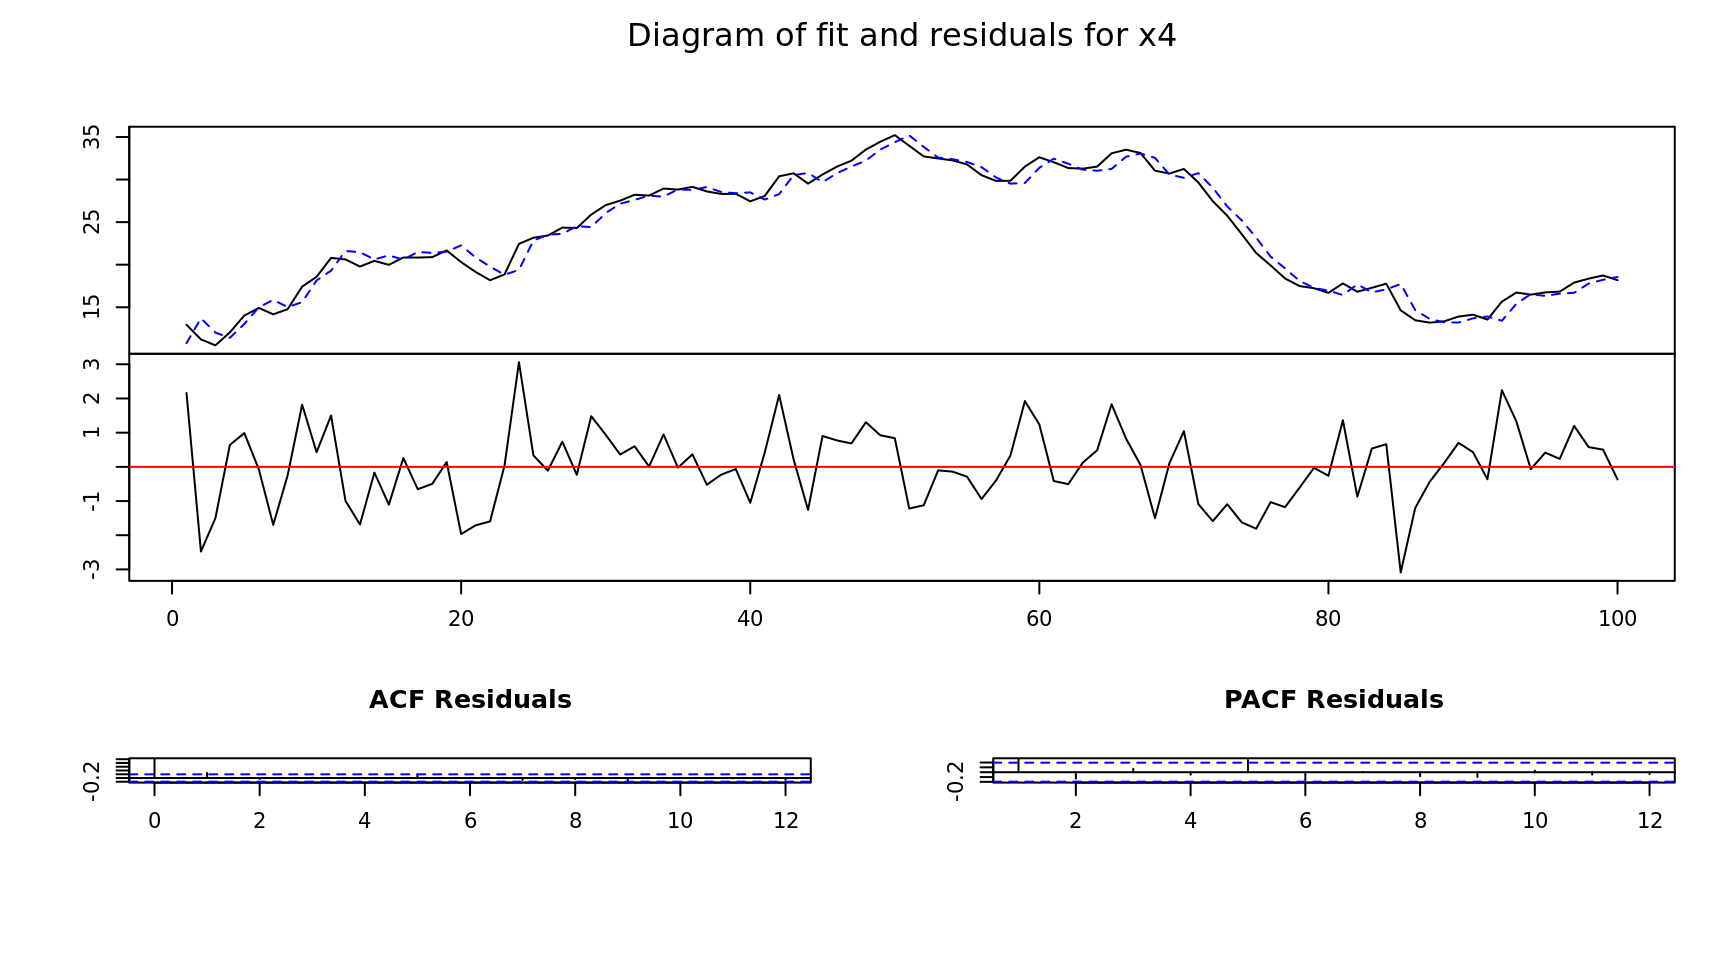
VAR Modeling
library(vars)

# Generated Time Series
x1  = 10 + arima.sim(n = 100,model = list(order = c(1, 1, 1), ar = .1, ma = .2))
x2  = 10 + arima.sim(n = 100,model = list(order = c(1, 1, 1), ar = .1, ma = .2))
x3  = 10 + arima.sim(n = 100,model = list(order = c(1, 1, 1), ar = .1, ma = .2))
x4  = 10 + arima.sim(n = 100,model = list(order = c(1, 1, 1), ar = .1, ma = .2))

# Combine into a multivariate time series
x = data.frame(x1, x2, x3, x4)

# Create a variable auto-regression modle
mdl = VAR(x)

# Model summary
summary(mdl)
VAR Estimation Results:
=========================
Endogenous variables: x1, x2, x3, x4
Deterministic variables: const
Sample size: 100
Log Likelihood: -554.174
Roots of the characteristic polynomial:
1.001 0.9732 0.9732 0.8473
Call:
VAR(y = x)


Estimation results for equation x1:
===================================
x1 = x1.l1 + x2.l1 + x3.l1 + x4.l1 + const

       Estimate Std. Error t value Pr(>|t|)
x1.l1  0.963228   0.018160  53.040  < 2e-16 ***
x2.l1  0.075584   0.031008   2.438  0.01665 *
x3.l1  0.143179   0.043729   3.274  0.00148 **
x4.l1  0.007627   0.017186   0.444  0.65822
const -1.425166   0.584460  -2.438  0.01661 *
---
Signif. codes:  0 '***' 0.001 '**' 0.01 '*' 0.05 '.' 0.1 ' ' 1


Residual standard error: 0.868 on 95 degrees of freedom
Multiple R-Squared: 0.9881, Adjusted R-squared: 0.9876
F-statistic:  1971 on 4 and 95 DF,  p-value: < 2.2e-16


Estimation results for equation x2:
===================================
x2 = x1.l1 + x2.l1 + x3.l1 + x4.l1 + const

       Estimate Std. Error t value Pr(>|t|)
x1.l1 -0.001462   0.019970  -0.073    0.942
x2.l1  0.972519   0.034098  28.521   <2e-16 ***
x3.l1  0.025001   0.048087   0.520    0.604
x4.l1  0.031043   0.018899   1.643    0.104
const -0.535590   0.642706  -0.833    0.407
---
Signif. codes:  0 '***' 0.001 '**' 0.01 '*' 0.05 '.' 0.1 ' ' 1


Residual standard error: 0.9545 on 95 degrees of freedom
Multiple R-Squared: 0.9251, Adjusted R-squared: 0.9219
F-statistic: 293.2 on 4 and 95 DF,  p-value: < 2.2e-16


Estimation results for equation x3:
===================================
x3 = x1.l1 + x2.l1 + x3.l1 + x4.l1 + const

      Estimate Std. Error t value Pr(>|t|)
x1.l1  0.02503    0.02235   1.120   0.2656
x2.l1 -0.01399    0.03816  -0.367   0.7147
x3.l1  0.85840    0.05381  15.951   <2e-16 ***
x4.l1 -0.04462    0.02115  -2.110   0.0375 *
const  1.36738    0.71927   1.901   0.0603 .
---
Signif. codes:  0 '***' 0.001 '**' 0.01 '*' 0.05 '.' 0.1 ' ' 1


Residual standard error: 1.068 on 95 degrees of freedom
Multiple R-Squared: 0.929,  Adjusted R-squared: 0.926
F-statistic: 310.8 on 4 and 95 DF,  p-value: < 2.2e-16


Estimation results for equation x4:
===================================
x4 = x1.l1 + x2.l1 + x3.l1 + x4.l1 + const

      Estimate Std. Error t value Pr(>|t|)
x1.l1  0.01831    0.02364   0.774    0.441
x2.l1 -0.01214    0.04037  -0.301    0.764
x3.l1  0.07116    0.05693   1.250    0.214
x4.l1  0.99872    0.02238  44.633   <2e-16 ***
const  0.02153    0.76094   0.028    0.977
---
Signif. codes:  0 '***' 0.001 '**' 0.01 '*' 0.05 '.' 0.1 ' ' 1


Residual standard error: 1.13 on 95 degrees of freedom
Multiple R-Squared: 0.9751, Adjusted R-squared: 0.9741
F-statistic:   930 on 4 and 95 DF,  p-value: < 2.2e-16


Covariance matrix of residuals:
         x1       x2       x3       x4
x1  0.75349 -0.09141 -0.01242 -0.05868
x2 -0.09141  0.91116 -0.06800  0.08389
x3 -0.01242 -0.06800  1.14116 -0.23538
x4 -0.05868  0.08389 -0.23538  1.27722

Correlation matrix of residuals:
         x1       x2       x3       x4
x1  1.00000 -0.11032 -0.01339 -0.05981
x2 -0.11032  1.00000 -0.06669  0.07777
x3 -0.01339 -0.06669  1.00000 -0.19497
x4 -0.05981  0.07777 -0.19497  1.00000
