Hypothesis Testing
- Shapiro Wilks
- One Sample T-Test
- Calculating Power
- Hypothesis Testing
- Sample Size Determination
  weight      feed
1    179 horsebean
2    160 horsebean
3    136 horsebean
4    227 horsebean
5    217 horsebean
6    168 horsebean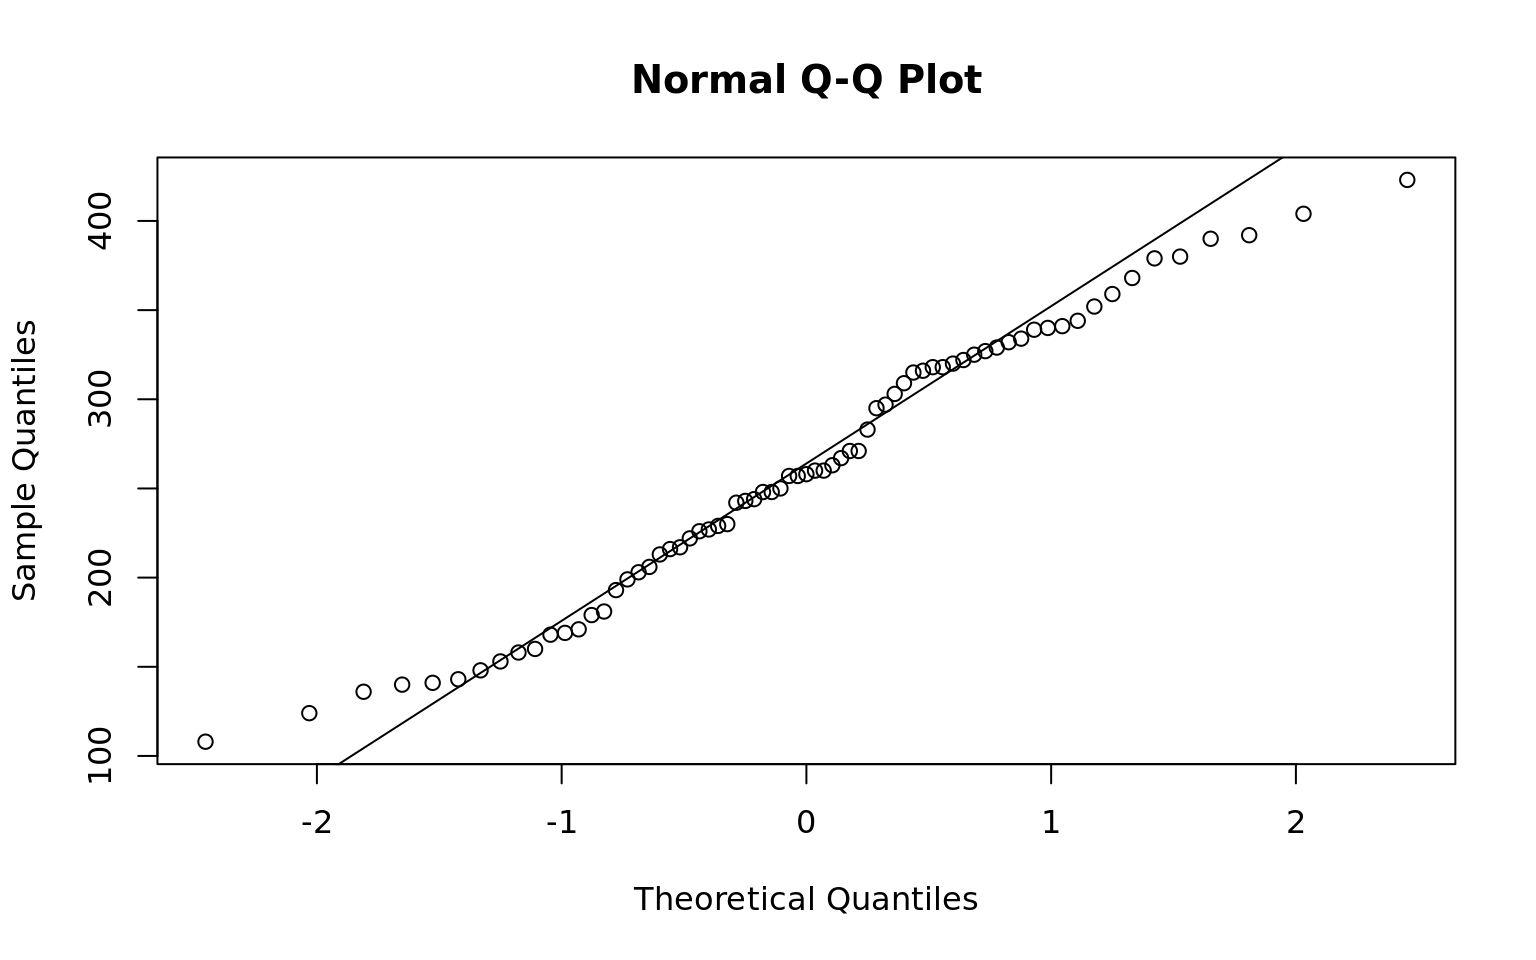
    Shapiro-Wilk normality test

data:  chickwts$weight
W = 0.97674, p-value = 0.2101[1] 261.3099How does the sample mean compare to a hypothesis test that the true mean is < 260? What is the power of the test?
\[H_0: \mu \ge 260, H_a: \mu \lt 260\]
| Population | Fail to Reject | Reject \(H_0\) |
|---|---|---|
| \(H_0\) is True | Correct | Type I Error |
| \(H_a\) is True | Type II Error | Correct |
## What is the probability of a Type I error if we say the true mean is less than 250?
t.test(chickwts$weight, mu = 250, alternative = "less")
    One Sample t-test

data:  chickwts$weight
t = 1.2206, df = 70, p-value = 0.8868
alternative hypothesis: true mean is less than 250
95 percent confidence interval:
     -Inf 276.7549
sample estimates:
mean of x
 261.3099
## Verify the t statistic and p-value
(ts = (mean(chickwts$weight) - 250) / (sd(chickwts$weight) / sqrt(length(chickwts$weight))))[1] 1.220623[1] 0.8868377## What is the probability of a Type I error if we say the true mean is > 245?
t.test(chickwts$weight, mu = 245, alternative = "greater")
    One Sample t-test

data:  chickwts$weight
t = 1.7603, df = 70, p-value = 0.04137
alternative hypothesis: true mean is greater than 245
95 percent confidence interval:
 245.8648      Inf
sample estimates:
mean of x
 261.3099
## Verify the t statistic and p-value
(ts = (mean(chickwts$weight) - 245) / (sd(chickwts$weight) / sqrt(length(chickwts$weight))))[1] 1.760251[1] 0.04136678## We have rejected the null hypothesis and said under an alpha of .05 there is enough evidence
## to suppor that the true mean of Chick Weights is > 245
## What is the power of our test?
power.t.test(n = length(chickwts$weight),
delta = abs(mean(chickwts$weight) - 245),
sd = sd(chickwts$weight),
sig.level = .05,
type = "one.sample",
alternative = "one.sided", strict = TRUE)
     One-sample t test power calculation

              n = 71
          delta = 16.30986
             sd = 78.0737
      sig.level = 0.05
          power = 0.5391727
    alternative = one.sided
## What sample size would we need to have a power of .8?
power.t.test(delta = abs(mean(chickwts$weight) - 245),
sd = sd(chickwts$weight),
sig.level = .05,
power = .8,
type = "one.sample",
alternative = "one.sided", strict = TRUE)
     One-sample t test power calculation

              n = 143.0323
          delta = 16.30986
             sd = 78.0737
      sig.level = 0.05
          power = 0.8
    alternative = one.sided
## Verify manually
(sd(chickwts$weight)^2 * (qnorm(p = .95) + qnorm(p = .8))^2) / abs(mean(chickwts$weight) - 245)^2[1] 141.6698